Background
For a given a portfolio of investments there is an associated risk. However, there are many measures of risk (such as Greek letters) that simply describe different aspects of risk in a portfolio of derivatives. The goal of Value at Risk (VaR) is to provide an estimate of risk that summarises all aspects of risk into a single figure.
This figure simply answers the question: how bad could it get? An answer is provided with respect to two parameters: the time horizon and confidence level. That is, we are \(x%\) sure that our portfolio will not lose more than a certain amount over the next \(N\) days.
That certain amount is our VaR estimate. This estimate is widely used in industry.
Take for instance an investment bank. People deposit their money into this bank and, in turn, the bank invests this money in the stock market and earns money on the returns.
An investment with high returns is highly risky. The bank needs to keep a certain amount of cash in reserve to mitigate this risk. The size of this reserve is proportional to the bank’s exposure to risk, i.e. the VaR estimate.


In all cases, we take the parameters of our approaches from real-world historical market data, from Yahoo Finance.
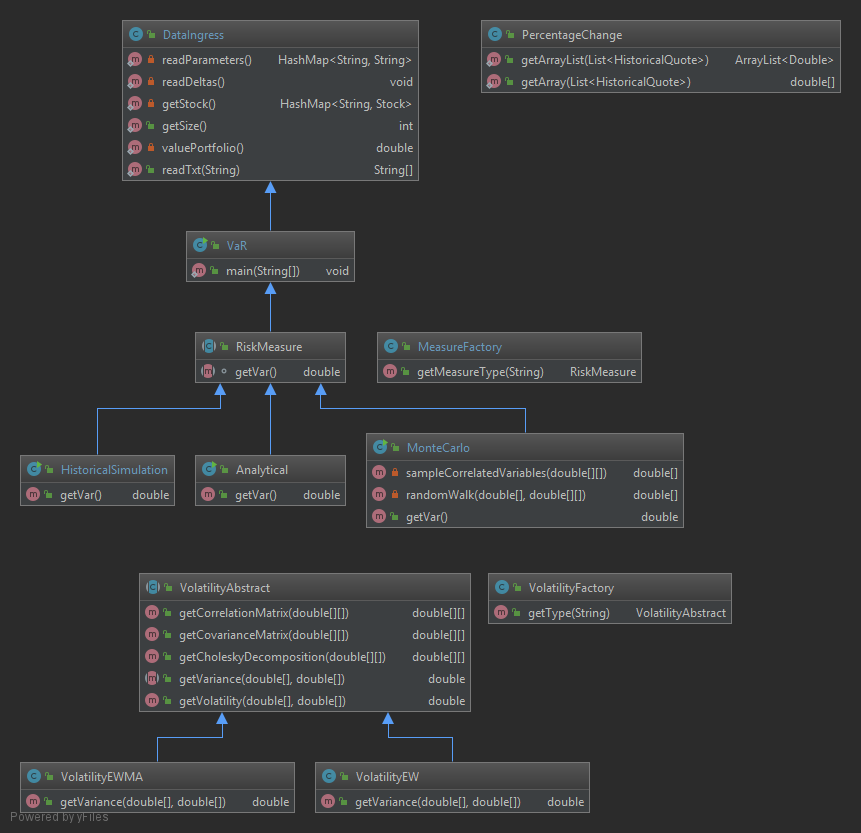
Class Diagram
VaR.java
public class VaR extends DataIngress {

    public static void main(String[] args) {
        HashMap<String, Double> varEstimates = new HashMap<>();

        MeasureFactory measureFactory = new MeasureFactory();
        try {
            for (String str : riskMeasures) {
                System.out.printf("\t%s\n", str);
                RiskMeasure riskMeasure = measureFactory.getMeasureType(str);

                Double VaR = riskMeasure.getVar();
                System.out.printf("\t\tVaR: %f\n", VaR);

                varEstimates.put(str, VaR);
            }
        } catch (Exception e) {
            e.printStackTrace();
        }
    }
}
Data Ingress
DataIngress.java is where data from local .txt files and Yahoo Finance are ingested.
Text Files
symbol.txtparameters.txtRiskMeasures.txt
And for each symbol in symbol.txt, there should be a corresponding file in /Deltas/.
/Deltas/*.txt
Variables
public static String[] strSymbols;
public static HashMap<String, String> hashParam;
public static String[] riskMeasures;
public static HashMap<String, Stock> stockHashMap;
public static HashMap<String, Integer> hashStockDeltas = new HashMap<>();
public static HashMap<String, Integer> hashOptionDeltas = new HashMap<>();
public static double currentPortfolio;
public static int countAsset;
public static int size;
Methods
- readParameters()
- readDeltas()
- getStock()
- getSize()
- valuePortfolio()
- readTxt()
Static Block
static {
    strSymbols = readTxt("symbol.txt");
    countAsset = strSymbols.length;
    hashParam = readParameters();
    riskMeasures = readTxt("RiskMeasures.txt");
    stockHashMap = getStock();
    readDeltas();
    currentPortfolio = valuePortfolio();
    size = getSize();
}
PercentageChange
In order to estimate variance and volatilities, we take the assumption that the percentage changes between the stock prices on each day can be modelled on the standard Gaussian Distribution, \(\Phi(0,1)\).
\[u_i = \frac{S_{i}-S_{i-1}}{S_{i-1}}\]The class PercentageChange.java has two methods that return historical percentage changes (=returns) in the form of an ArrayList<Double> and Double[].
getArrayList
We pass a collection of HistoricalQuote to getArrayList, which returns a collection of Double in an ArrayList.
That is, this is a collection of historical price data for a given stock.
In this method, we iterate through HistoricalQuote and invoke getClose(), which returns the stock price at the market close in the form of a BigDecimal type.
At each iteration, we take the previous and current BigDecimal and compute the percentage change.
Because working with BigDecimal is computationally expensive (=slow), we cast each result to double.
public static ArrayList<Double> getArrayList(List<HistoricalQuote> historicalQuotes) {
    ArrayList<Double> percentageChange = new ArrayList<>();
    Iterator<HistoricalQuote> iterator = historicalQuotes.iterator();
    BigDecimal a = iterator.next().getClose();
    while (iterator.hasNext()){
        BigDecimal b = iterator.next().getClose();
        BigDecimal PriceDiff = a
                                .subtract(b)
                                .divide(a, RoundingMode.HALF_UP);
        percentageChange.add(PriceDiff.doubleValue());
        a = b;
    }
    return percentageChange;
}
getArray
For our purposes, it’s much easier to use double[] types than ArrayList<Double>.
public static double[] getArray(List<HistoricalQuote> historicalQuotes) {
    ArrayList<Double> percentageChange = getArrayList(historicalQuotes);
    int size = percentageChange.size();
    double[] doubles = new double[size];

    for (int i = 0; i < size; i++)
        doubles[i] = percentageChange.get(i);

    return doubles;
}
Abstract Classes
RiskMeasure.javaVolatilityAbstract.java
RiskMeasure
public abstract class RiskMeasure extends VaR {

    abstract double getVar();

}
Volatility
The only abstract method defined in VolatilityAbstract.java is as follows:
abstract public double getVariance(double[] xVector, double[] yVector);
The classes that implement this method are:
VolatilityEW.javaVolatilityEWMA.javaVolatilityGARCH.java